
What Is OEE and Which Question Does It Answer?
OEE (Overall Equipment Effectiveness) expresses, in a single percentage, how much of its planned production time a piece of equipment actually spent creating value. It does not measure whether the machine was switched on; it measures how much of the time it ran was converted into flawless product.
That distinction matters. A high figure for “time spent at the machine” on its own tells you nothing: the machine may be powered up but waiting for a setup, running below its nominal speed, or producing parts that partly end up as scrap. OEE gathers these three families of loss under one roof and answers the question “how much of the shift actually produced sellable product?”
The measurement also gives every business discussing an automation investment a common language. Whether the answer is a new machine, an extra shift, or simply running the existing machines for longer is usually decided by looking at which component of OEE is low.
How Is OEE Calculated? Formula and a Step-by-Step Example
OEE is the product of three factors:
OEE = Availability × Performance × Quality
- Availability = Run Time ÷ Planned Production Time
- Performance = (Ideal Cycle Time × Total Parts Produced) ÷ Run Time
- Quality = Good Parts ÷ Total Parts Produced
A numerical example makes the formula concrete. Assume an 8-hour shift (480 minutes) with 30 minutes of planned breaks, so planned production time is 450 minutes. During the shift the machine was down for 60 minutes because of a breakdown and a setup, meaning it ran for 390 minutes. On a job whose ideal cycle time is one minute per part, 350 parts were produced and 14 of them were scrapped.
- Availability = 390 ÷ 450 = 86.7%
- Performance = (1 × 350) ÷ 390 = 89.7%
- Quality = (350 − 14) ÷ 350 = 96.0%
- OEE = 0.867 × 0.897 × 0.960 = 74.7%
None of the three components looks disastrous, yet the result sits around 75%. This is the most instructive property of OEE: losses are not added, they are multiplied. A few points gained in each component compound into a much larger gain in the result.
Field note: The definition of planned production time varies from plant to plant, and this is what really breaks comparisons. Are planned maintenance, breaks and idle time caused by a lack of demand excluded from planned time, or counted inside it? Until that definition is written down, OEE figures from different lines or different sites should not be placed side by side.
Which Losses Do Availability, Performance and Quality Measure?
Each of the three components covers two of the loss types classically known as the “six big losses”. For a business that wants to turn measurement into improvement, this is the useful breakdown.
Availability losses: unplanned stops (breakdowns, tool breakage, power cuts) and planned stops (machine setup, tool or fixture changeover, product transitions). This is usually the largest family of loss and is directly tied to maintenance strategy. A preventive maintenance plan for industrial robots therefore acts directly on the component of OEE that is easiest to lift.
Performance losses: small stops (a few minutes of jamming, a feeding hiccup, a sensor fault) and slow running (production below nominal speed). The insidious thing about small stops is that operators rarely report them as “downtime”; because they are never recorded, they stay invisible.
Quality losses: start-up scrap (first parts, warm-up, adjustment) and production scrap (defective parts arising during the process). Reworked parts are a quality loss too; because they were not made right first time, they consume line capacity a second time.
Is 85% OEE a Realistic Target?
The threshold most often cited in the literature as “world class” is 85%, which corresponds roughly to 90% availability, 95% performance and 99% quality. A typical starting level in discrete parts manufacturing is frequently quoted as being around 60%.
Treating these numbers as an absolute report card is misleading, though. A job shop working with high variety and small batches inevitably spends more time on setups; the same business cannot reach — and does not need to reach — the OEE of a single-product line. The correct use is not to compete with an industry average but to compare a machine against its own history.
A second caution: once OEE becomes a target in itself, it is easily gamed. The percentage can be lifted by narrowing planned production time, by loosening the ideal cycle time, or simply by not reporting small stops. What makes the indicator meaningful is keeping the definitions fixed and the raw data traceable.
How Do Takt Time and Cycle Time Relate to OEE?
Takt time tells you the rhythm at which a part has to leave the line in order to meet customer demand: Takt Time = Available Production Time ÷ Customer Demand. On a line running 450 minutes a day against demand for 300 parts, takt time is 1.5 minutes.
Cycle time is how long the line actually takes to release one part. The performance component of OEE tracks exactly the gap between the two: as actual cycle time stretches beyond ideal cycle time, performance falls.
In practice the relationship works like this: if the takt time target is being missed, the answer is not always a faster machine. In most cases the loss has accumulated in the availability line, not in the cycle itself. Seeing which component of OEE is low before making an investment decision eliminates unnecessary capacity spending from the outset. How cycle time is verified on the robot side is covered step by step in our article on choosing the right robot: payload, reach and cycle time.
What Are the Most Common Mistakes in Measuring OEE?
The mistakes repeated on the shop floor look remarkably similar everywhere. The first is collecting the data from hand-written shift sheets. When operators report their own downtime, small stops disappear systematically and OEE comes out higher than it really is.
The second is taking the ideal cycle time to be “the time we achieve on a good day”. Ideal cycle time is the shortest time the machine is technically capable of; loosening that value inflates the performance component artificially.
The third is counting reworked parts as good. The fourth is reporting OEE as a single headline number without splitting it into its components; a figure of 70% produces no action at all unless it says whether the loss sits in downtime, in speed or in scrap.
The fifth is trying to raise the OEE of a machine that is not the bottleneck. Line output is set by the bottleneck; every point gained on a non-bottleneck machine accumulates as inventory and never reaches delivery performance.
Field note: The cheapest first step towards automating the measurement is to read the signals the machine already produces. An end-of-cycle signal, door status and alarm bits are present in most control units already. Carrying that data into a production management system is covered separately in our article on integrating MES with robotic systems.
Which Component of OEE Does Robotic Automation Raise?
Contrary to the common expectation, the effect of robotic automation on OEE is not primarily speed. A robot does not change the cutting speed of a machine tool; what it changes is how long the machine spends cutting.
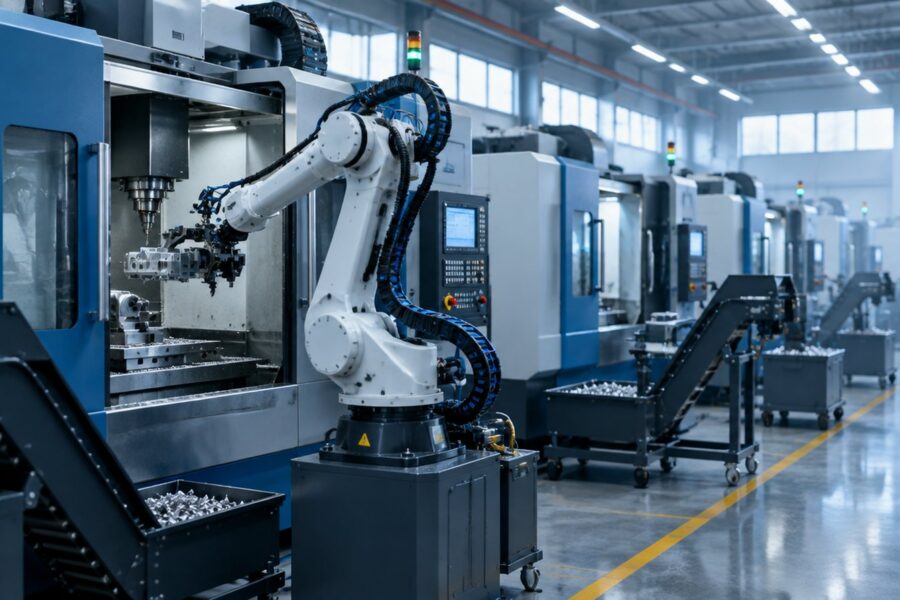
The largest contribution lands on availability. A machine that stops because the operator went on a break, waited for a shift handover, was dealing with another machine, or ran out of staged parts keeps running under robotic feeding. These “invisible” stops around shift ends and lunch breaks are, in most plants, the single biggest item of loss.
The second contribution is to performance. A robot loads the part in the same time and in the same position every cycle; loading does not get slower in the eighth hour of the shift. Small stops fall too, because the feeding arrangement becomes standardised.
The third contribution appears in quality and is usually the smallest — but the most visible. As clamping repeatability improves, the error margin caused by fixturing drops; and when in-process inspection is added, a defective part is caught early in the line. Our article on quality control with robotic machine vision sets out a detailed framework for this.
What Does Raising CNC Machine OEE with a Robot Look Like on the Floor?
CNC machining is where the effect of robotic feeding on OEE is seen most clearly, because while the machine is cutting there is nothing for the operator to do; the operator simply waits for the cycle to end. The longer the cycle, the larger that waiting time becomes, and labour turns into non-value-adding waiting.
At this point two different gains must not be confused. The first is the labour gain obtained by freeing the operator. The second, and usually the larger, is the additional running time obtained because the machine no longer stops for breaks or shift handovers. The second is written directly into the availability component of OEE.
How many machines one robot can feed depends directly on cycle time: the longer the cycle, the more machines the robot can keep up with. We shared measured examples of that calculation in our article on how many CNC machines a single robot can run. For the unattended night-shift scenario, see 24/7 production with robotic CNC tending.
How Does OEE Data Justify an Automation Investment?
The return on an automation investment is usually calculated on labour savings alone, and that calculation is almost always incomplete. OEE data makes the second — and often larger — item of the gain visible: how many parts the recovered production time corresponds to.
Setting up the calculation is straightforward. Measure current OEE, estimate how much each loss item would fall in the robotic scenario, and convert the difference into parts and the parts into contribution margin. The strength of this approach is that it moves the discussion from “how many people will the robot replace?” to “how many more parts will we ship per month, and what is that worth?”
For businesses constrained by capacity this difference is critical: capacity obtained without opening an extra shift or buying another machine is the most concrete justification an investment can have. How the payback period is constructed is covered in our article on the payback period for automation investments, and the article on producing 5,000+ parts a month puts the same calculation into numbers.
Where Should an OEE Improvement Programme Start?
The correct order is this: identify the bottleneck machine, record downtime reasons on that machine for two weeks, then distribute the losses across the three components. Any investment made before these three steps are complete rests on guesswork.
Once the recording is done, the picture usually differs from what was expected. Many businesses start out convinced they have a speed problem and find at the end of the measurement that most of the loss had accumulated in unfed time and in setup times. That changes the address of the intervention.
After the measurement, whether the robotic scenario will actually work in the real layout of the line can be verified before the investment decision is taken. Measuring the existing layout and modelling the flow through a site survey and simulation step costs far less than rearranging the line afterwards.
OEE is not a reporting line item; it is a map showing which investment closes which loss. Once you have measured which component your machines are losing in, you can see the numerical equivalent of a robotic feeding scenario for your own line during project management and verify it before commissioning with simulation. On our industrial CNC automation systems and cobot CNC automation systems pages you can review which machine and part ranges these scenarios fit.